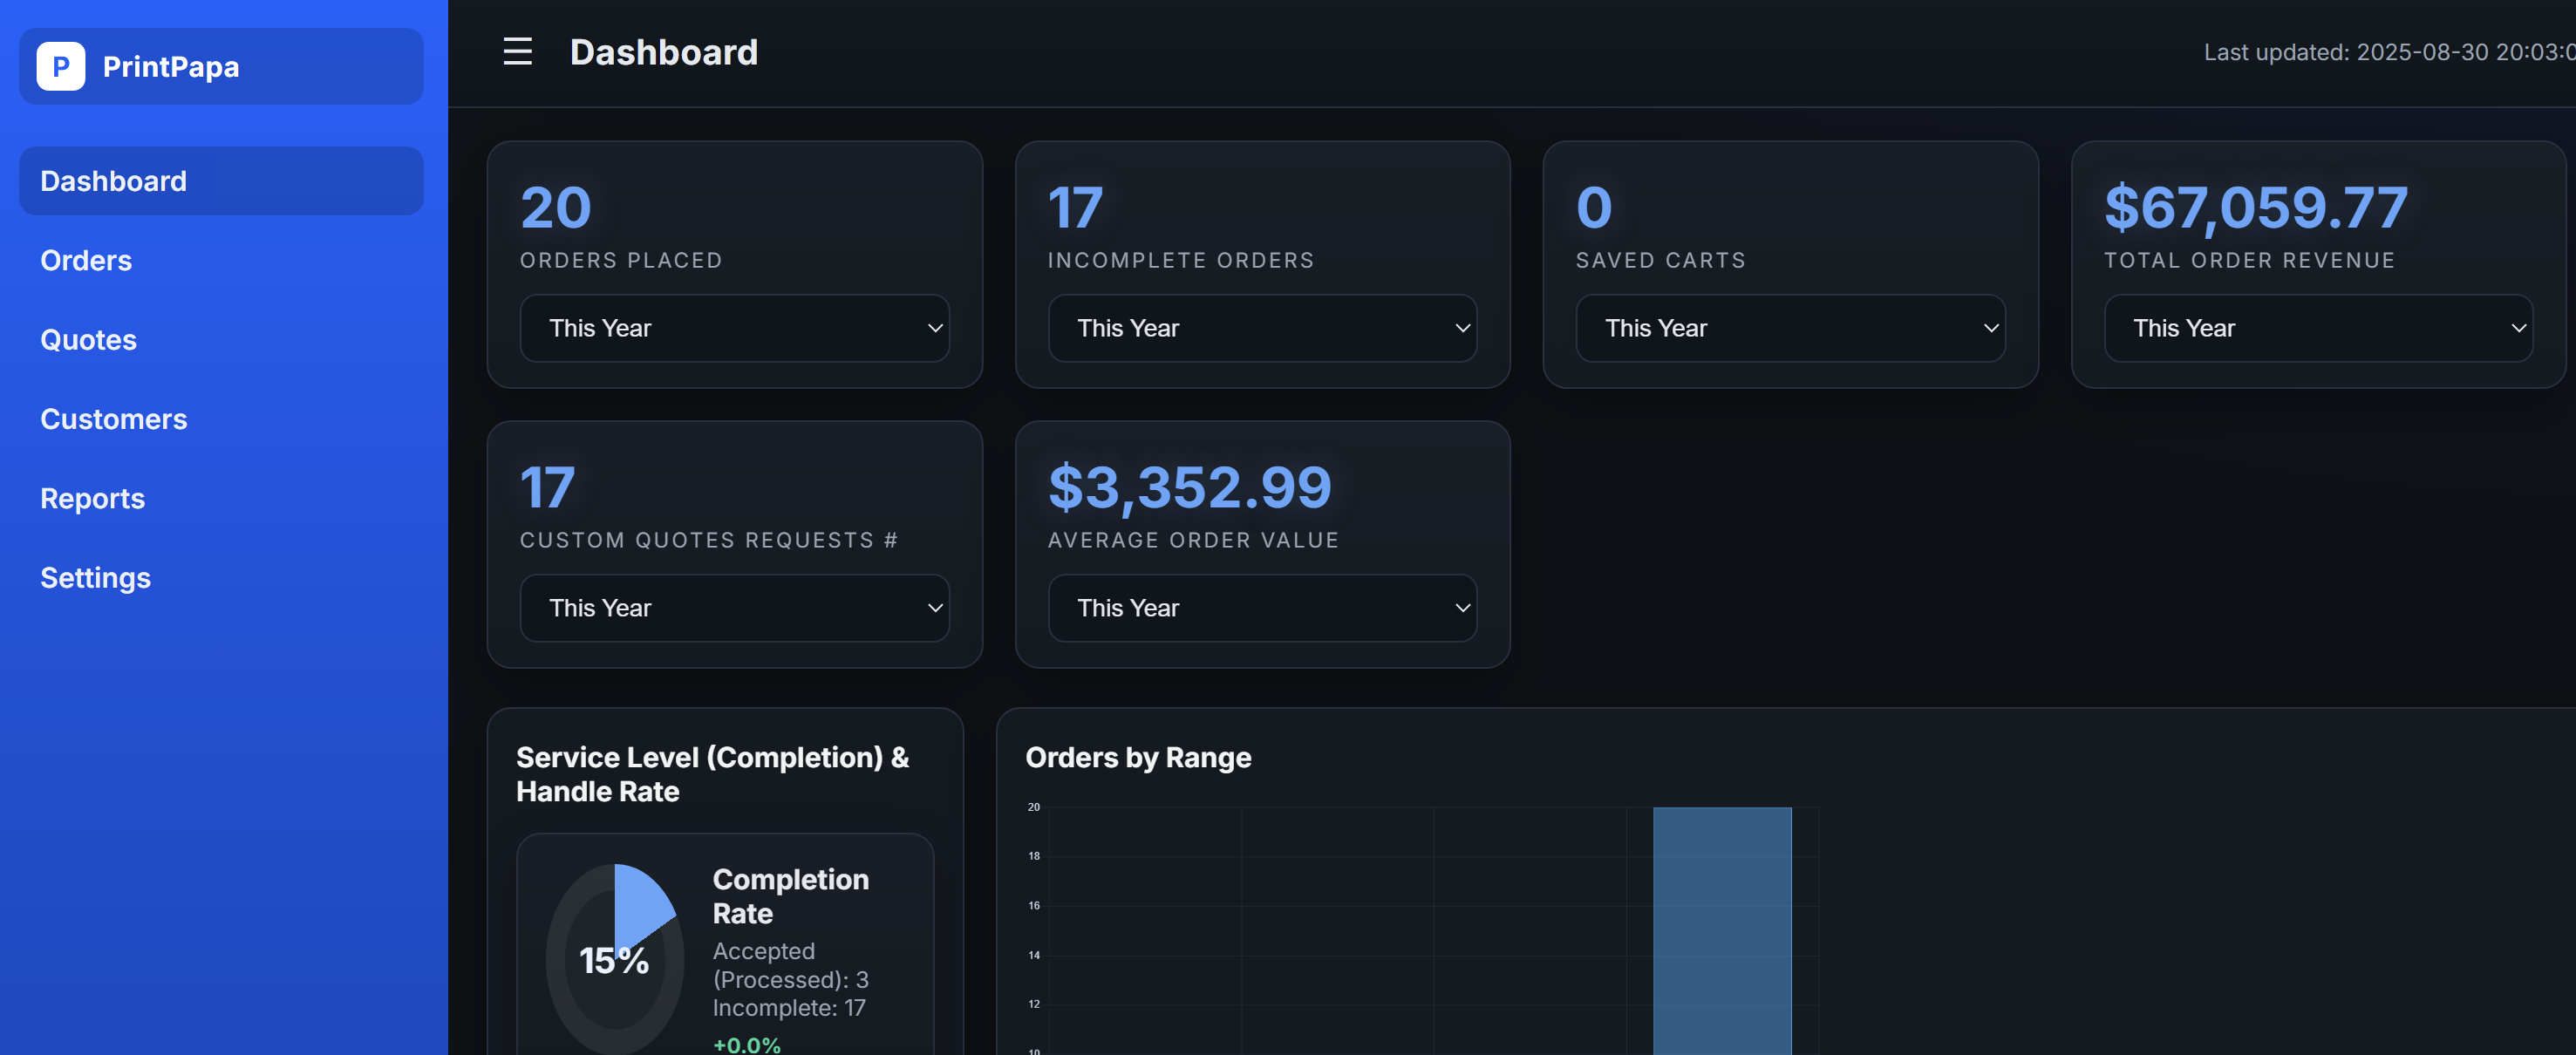
PrintPapa AI-Powered KPI Dashboard
A production dashboard leadership uses for real-time visibility into performance metrics — with an ML layer for forecasting and recommendations on top.
Overview
I led the design and deployment of a KPI dashboard giving PrintPapa leadership real-time visibility into performance metrics — this is a live production system used directly by leadership, not a personal project, and that's the most credible proof point in my project history.
Problem
Leadership needed real-time visibility into operational KPIs to make faster decisions, but the data lived across operational systems without a translation layer turning it into something usable at a glance.
Business Context
PrintPapa is an e-commerce printing company where operational speed directly affects margins — a dashboard that surfaces the right signal faster changes real decisions, not just a demo metric.
Architecture
Operational data in SQL Server flows through a Python/Pandas transformation and QA pipeline into the dashboard's service layer, with a separate ML layer — fine-tuned LLMs and vector search — feeding AI-powered sales forecasting and recommendations on top of the core pipeline.
Tech Stack
Implementation
I translated business requirements into technical solutions by building the data pipelines in Python, Pandas, and SQL Server, then visualized the results in an interactive dashboard. To take it further, I integrated machine-learning workflows — fine-tuning LLMs and applying vector search — to deliver AI-powered recommendations for sales tracking and forecasting.
Tradeoffs
The forecasting layer trades some interpretability for predictive power — a fine-tuned LLM's recommendation is harder to fully explain than a simple moving-average forecast would be, which matters when the audience is leadership making real spending decisions off the output.
Lessons Learned
This project required merging technical fluency in data engineering and machine learning with stakeholder collaboration — the dashboard's value came as much from correctly identifying what leadership actually needed to see as from the pipeline behind it.
Gallery